Which city has the most diverse food?
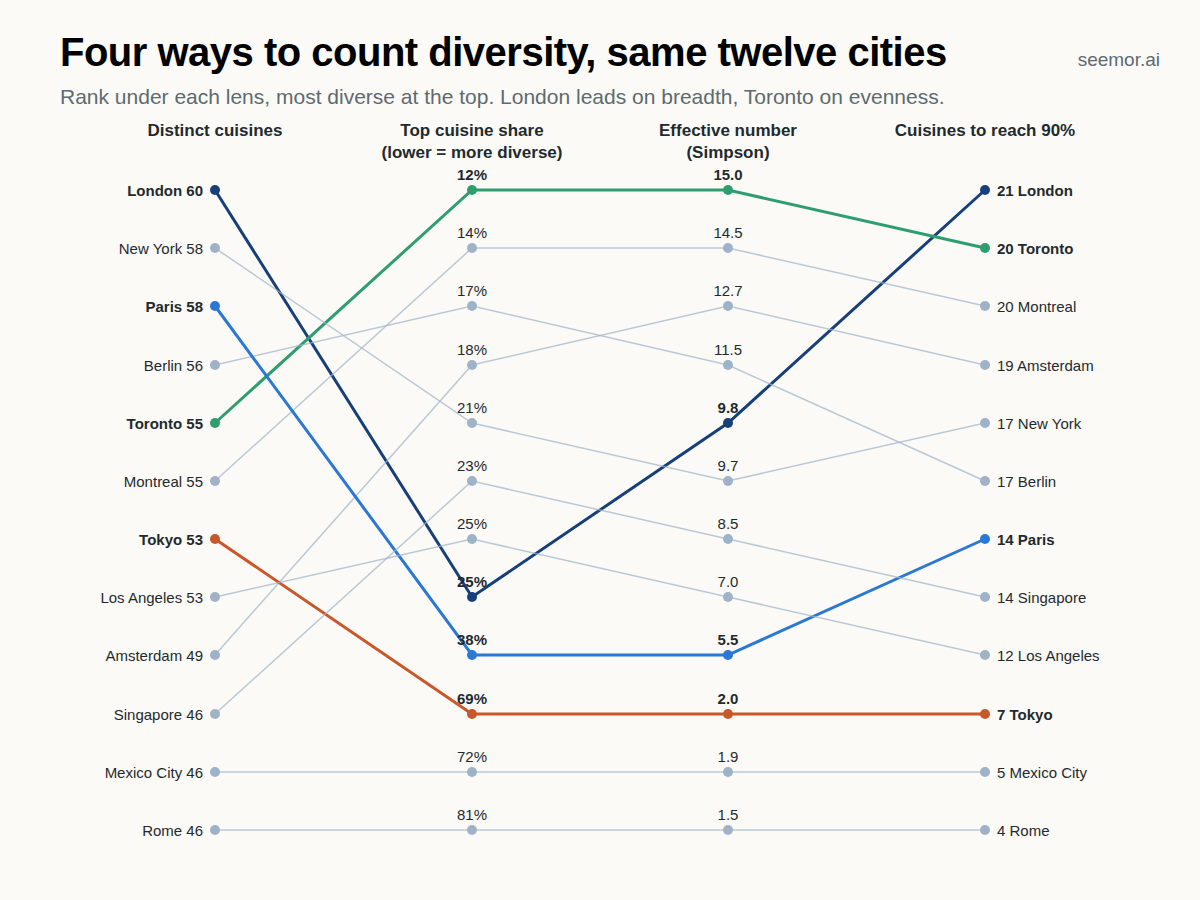
It depends how you count. London has the widest spread of cuisines, Toronto the most even, and Rome is 81 percent Italian. This is the chart from the article with the cities swappable: swap in any of the 38, up to sixteen at a time. The full piece, with the hypotheses tested and what still has no explanation, is at Which city has the most diverse food: it depends how you count.
London needs 21 cuisines to cover 90% of its restaurants, Rome just 4: Rome is 81% Italian.
What this measures
Share of analyzed restaurants by cuisine, cities ordered by the number of cuisines needed to cover 90% of them. Home cuisine in navy, the next seven in blues, every other cuisine in gray. Tap a city name for its page.
London
21 cuisines to 90% · 17,505 restaurants · 60 cuisines in all- British25%
- Italian13%
- Indian8.2%
- Chinese5.0%
- American4.9%
- Japanese4.9%
- Turkish4.5%
- Cafe4.2%
- + 52 more cuisines, 30% between them
Toronto
20 cuisines to 90% · 4,010 restaurants · 55 cuisines in all- Italian12%
- Canadian12%
- American9.5%
- Japanese9.1%
- Chinese6.5%
- Middle Eastern6.1%
- Indian5.8%
- Mexican5.5%
- + 47 more cuisines, 33% between them
Lisbon
11 cuisines to 90% · 3,304 restaurants · 47 cuisines in all- Portuguese53%
- Italian9.3%
- Japanese7.0%
- American3.8%
- Brazilian3.7%
- Chinese2.8%
- Indian2.6%
- Cafe2.3%
- + 39 more cuisines, 15% between them
Rome
4 cuisines to 90% · 5,932 restaurants · 46 cuisines in all- Italian81%
- Chinese4.0%
- Japanese3.5%
- American3.3%
- Steakhouse1.4%
- Hawaiian0.7%
- Middle Eastern0.6%
- Irish0.5%
- + 38 more cuisines, 5% between them
Get the next question before anyone else
Each question arrives with a post from Ryan Fuller. One email when it lands, with the chart and the link. Ask for a city while you are at it.
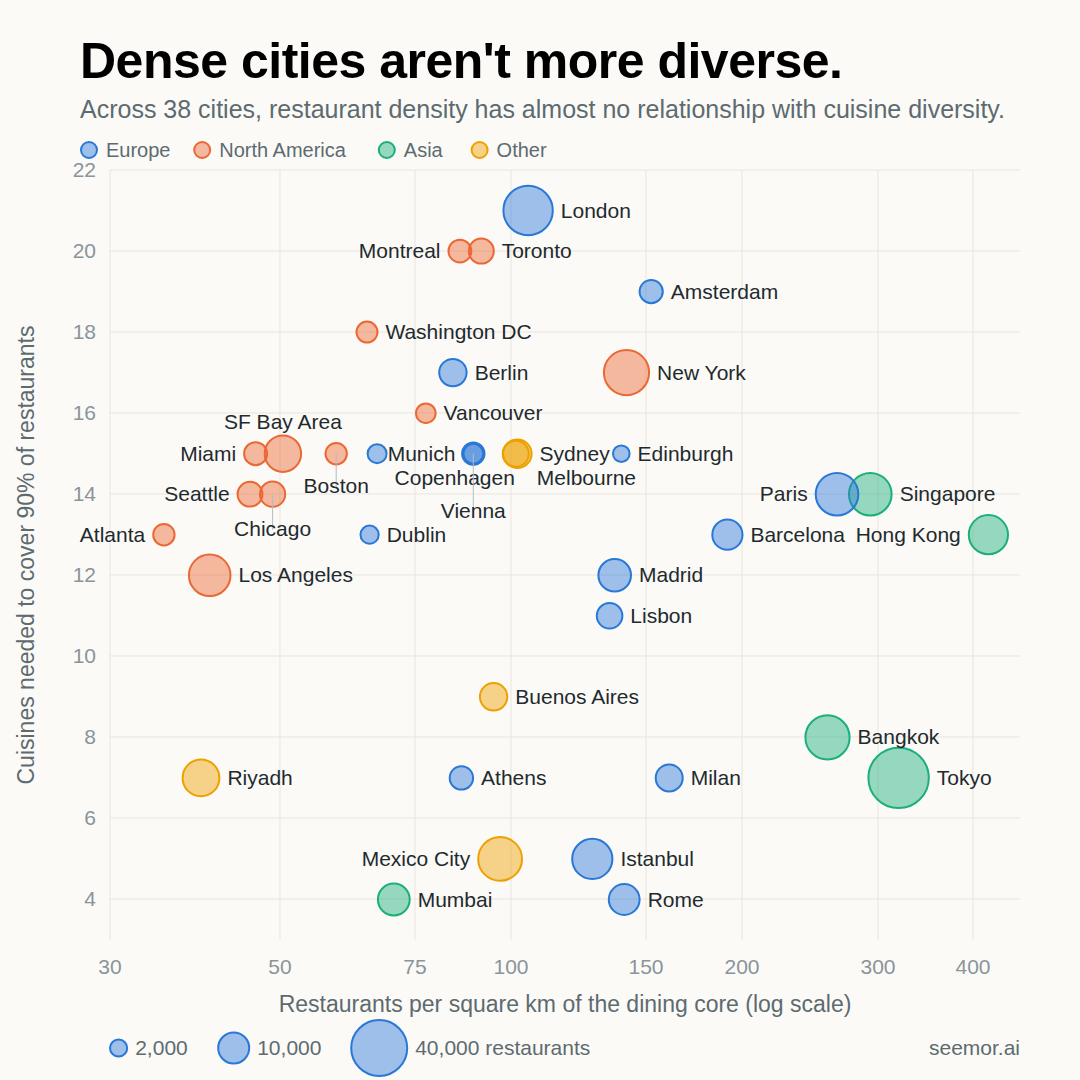
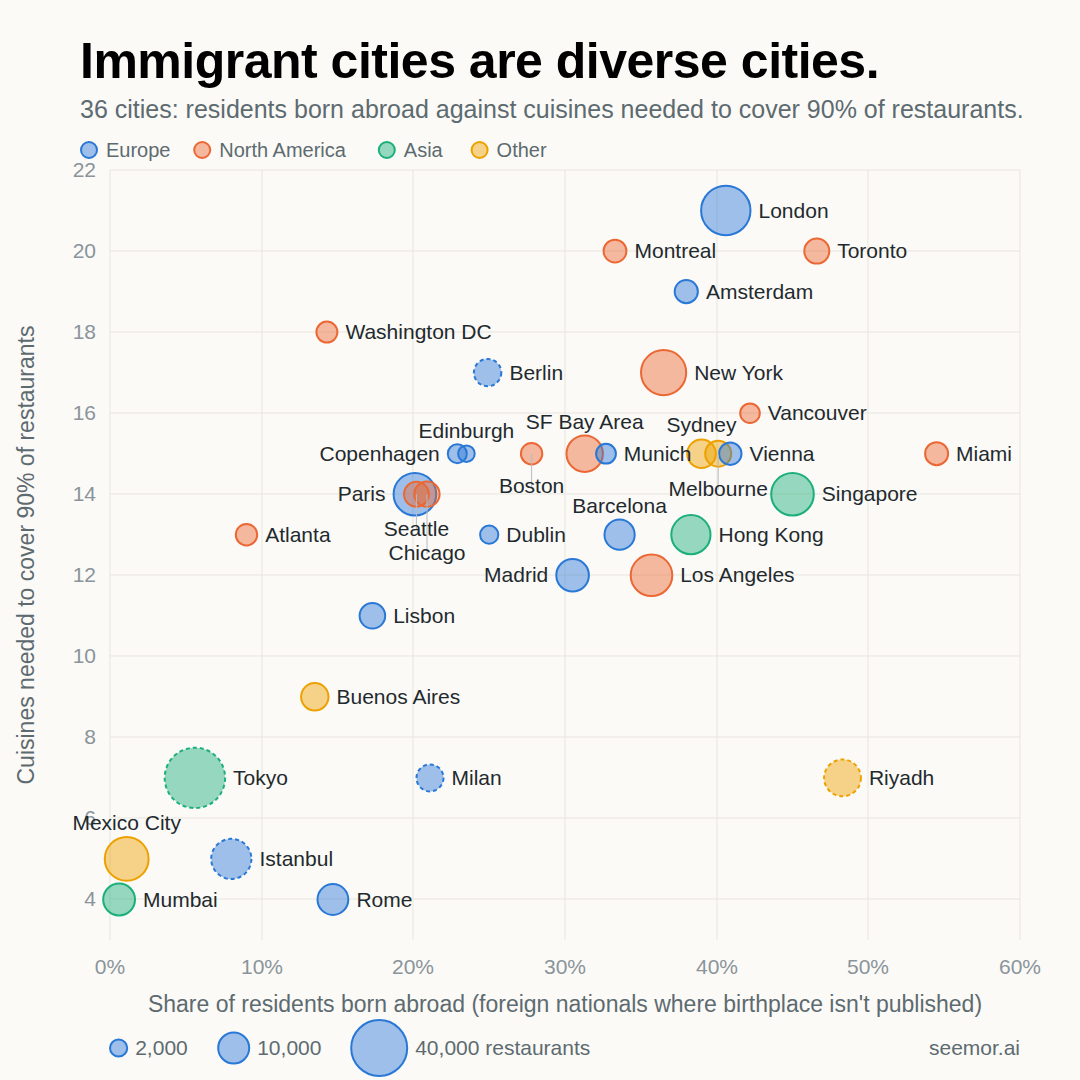
Cities shown: 30,751 analyzed restaurants with a cuisine, data from October 2026. A pub counts as the cuisine it serves. “Cuisines to 90%” is how many cuisines, largest first, it takes to cover 90% of a city's restaurants; it ranks cities almost identically to the inverse Simpson index and is easier to explain. Full method, the other measures and the density and immigration charts are in the article.
The article measured 44 cities. This page keeps the 38 major ones and leaves out six smaller or regional cities from that list (Newcastle, Bristol, Glasgow, Birmingham, Atlanta, Bengaluru); the numbers for the rest are the article's own, unchanged.
The rest of the analysis
These charts are fixed; each opens the article at the part that explains it.